RPE Chart: RPE to Percentage of 1RM, Borg Scale and How to Use It
An RPE chart turns reps and RPE into a percentage of your one rep max: 5 reps at RPE 8 is about 81% of 1RM, 3 reps at RPE 9 is about 89%, and a single at RPE 10 is 100%. Find the rep count in the row, the RPE in the column, and the cell is the load. Below is the full table, plus the Borg scales cardio coaches mean when they say RPE.

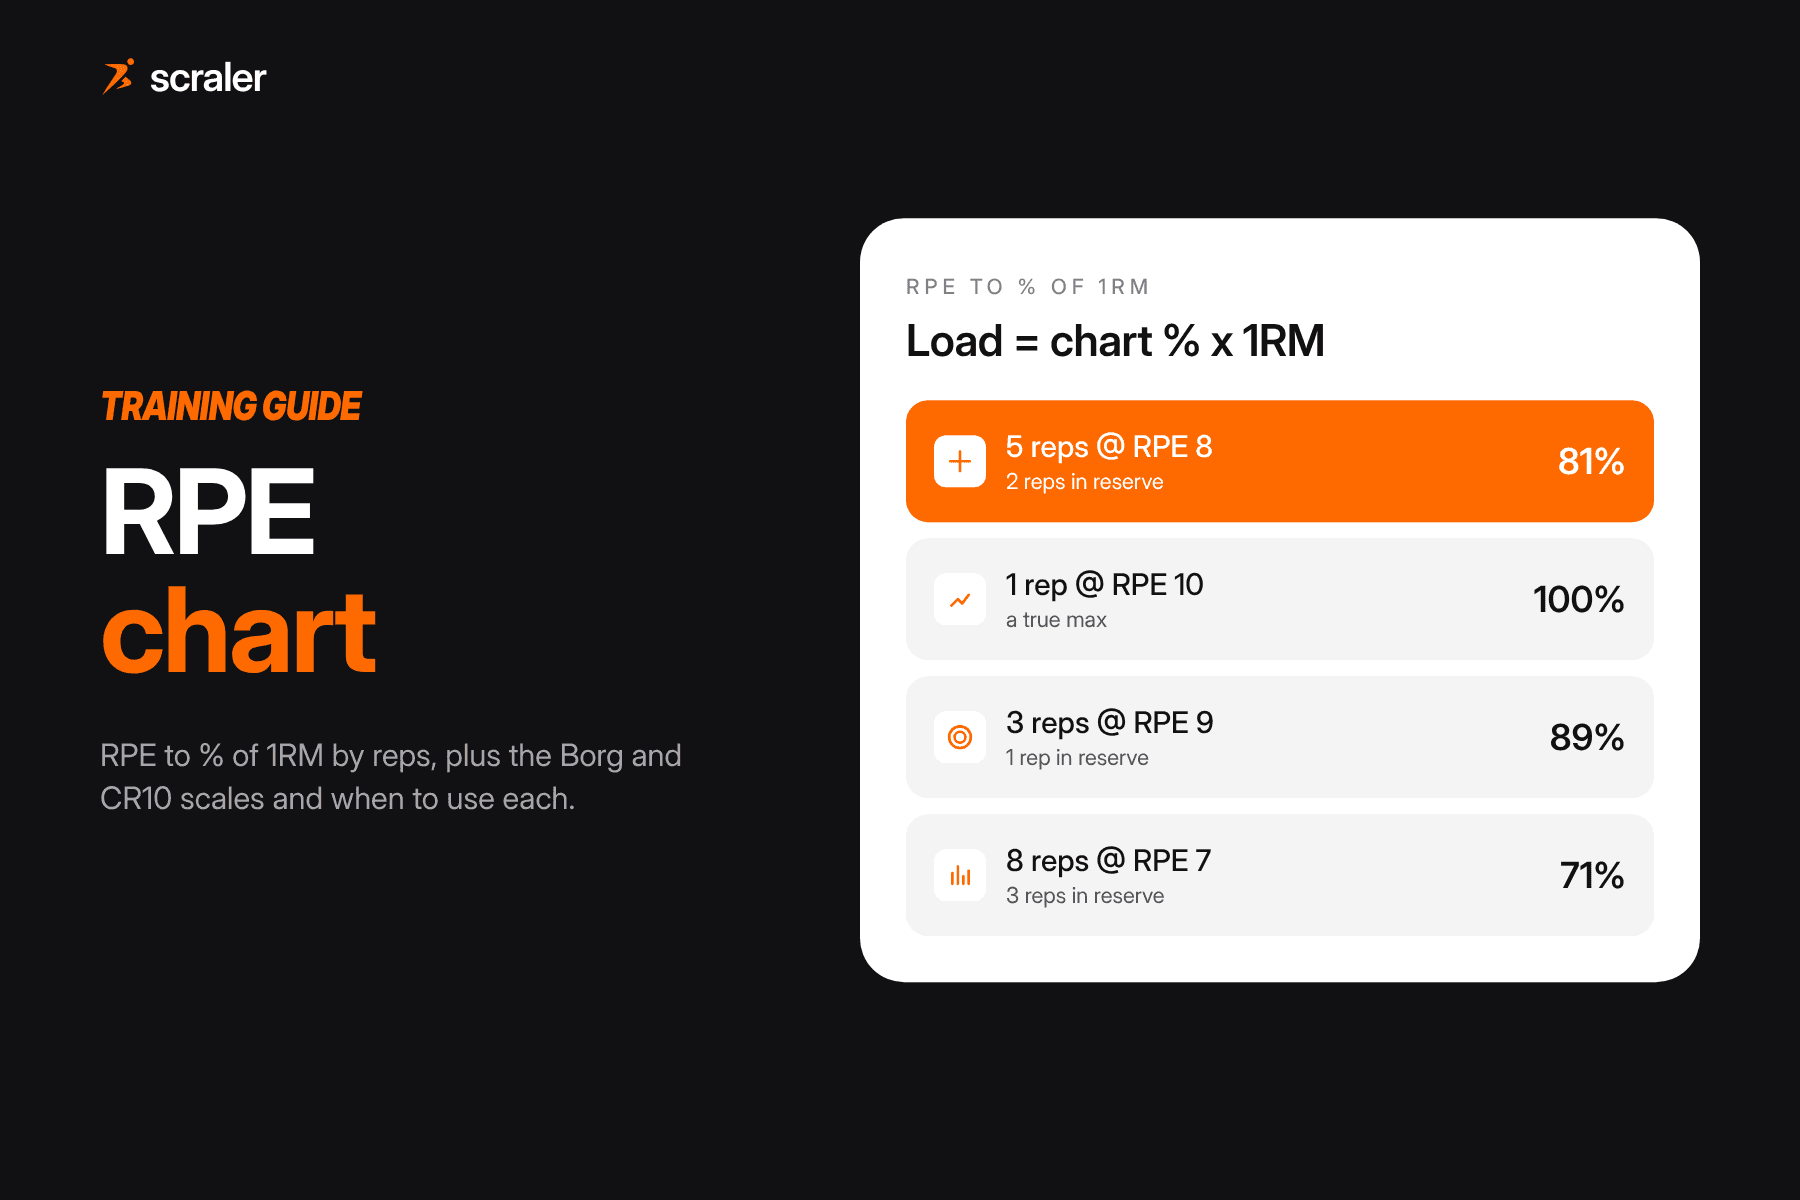
- The lifting RPE chart lists % of 1RM for each rep count and RPE. Each cell is reps plus reps in reserve: 1 rep at RPE 8 and 3 reps at RPE 10 are both 92%, because both mean three reps were possible.
- The numbers are an approximation. Reps at a given % of 1RM differ between people and exercises, and lifters misjudge their reps left by about one rep on average.
- Use it two ways: divide a set's weight by its chart % to estimate your 1RM, or multiply an estimated 1RM by a target cell to pick today's load.
- The Borg 6 to 20 scale and the CR10 scale are different tools, built for cardio, testing and whole-session effort. Do not mix them with the 1 to 10 lifting scale in one program.
What is an RPE chart?
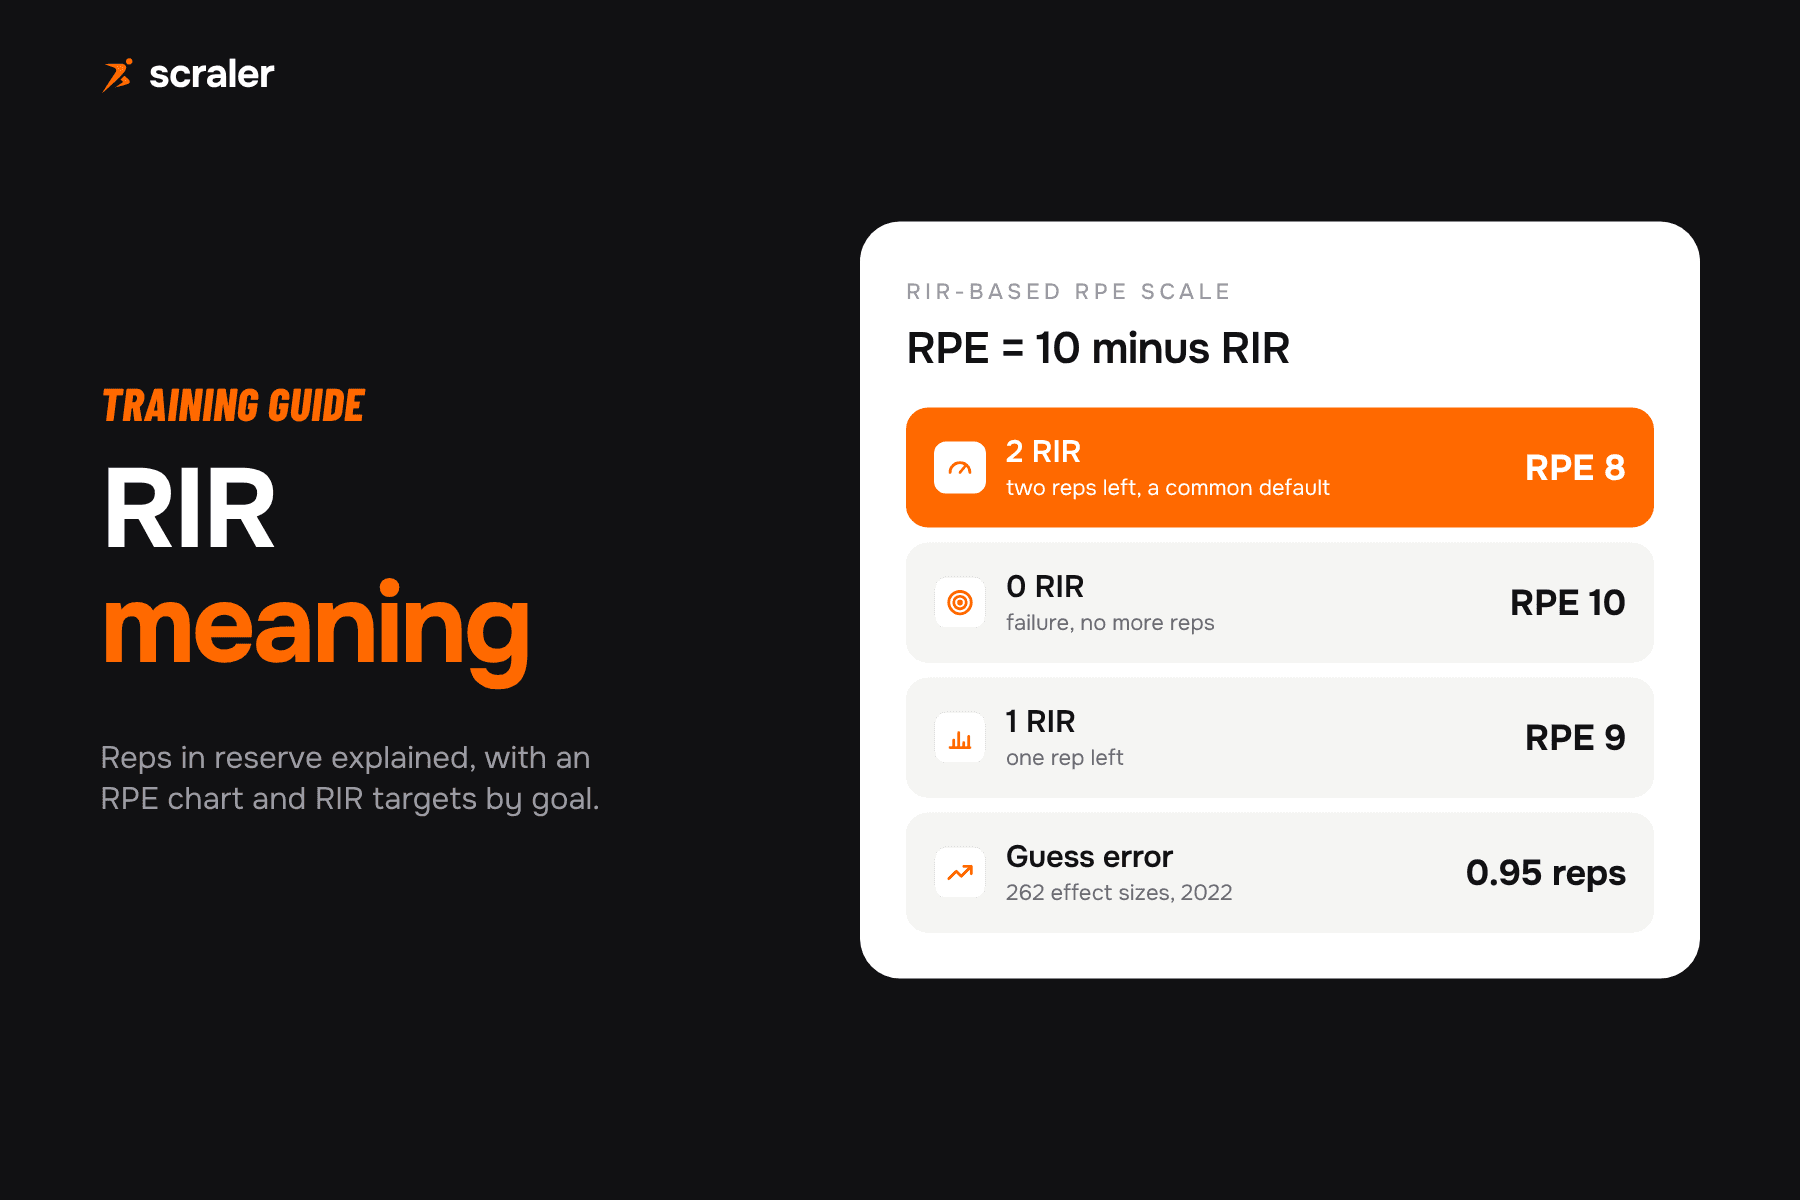
RPE stands for rating of perceived exertion. In lifting it usually means the RIR-based 1 to 10 scale, where the number tells you how many reps you had left: RPE 10 is no reps left, RPE 9 is one, RPE 8 is two, and half points sit in between. An RPE chart adds one more dimension. For every combination of reps and RPE it gives the load as a percentage of your one rep max (1RM).
That makes the chart a translator between two ways of programming. A coach can write "5 reps at RPE 8" and the chart tells the lifter that this is roughly 81% of their max. Or a lifter can log "100 kg for 5 at RPE 8" and the chart tells you their max is roughly 123 kg. If you want the full background on reps in reserve itself, read our guide to RIR meaning. This page is the reference chart.
RPE to percentage chart: % of 1RM by reps and RPE
Read across from the number of reps you did, down from the RPE of the set. The value is the percentage of 1RM. The RIR under each RPE is 10 minus RPE.
- RPE 10 (0 RIR)
- 100%
- RPE 9.5
- 98%
- RPE 9 (1 RIR)
- 96%
- RPE 8.5
- 94%
- RPE 8 (2 RIR)
- 92%
- RPE 7.5
- 91%
- RPE 7 (3 RIR)
- 89%
- RPE 6.5
- 88%
- RPE 10 (0 RIR)
- 96%
- RPE 9.5
- 94%
- RPE 9 (1 RIR)
- 92%
- RPE 8.5
- 91%
- RPE 8 (2 RIR)
- 89%
- RPE 7.5
- 88%
- RPE 7 (3 RIR)
- 86%
- RPE 6.5
- 85%
- RPE 10 (0 RIR)
- 92%
- RPE 9.5
- 91%
- RPE 9 (1 RIR)
- 89%
- RPE 8.5
- 88%
- RPE 8 (2 RIR)
- 86%
- RPE 7.5
- 85%
- RPE 7 (3 RIR)
- 84%
- RPE 6.5
- 82%
- RPE 10 (0 RIR)
- 89%
- RPE 9.5
- 88%
- RPE 9 (1 RIR)
- 86%
- RPE 8.5
- 85%
- RPE 8 (2 RIR)
- 84%
- RPE 7.5
- 82%
- RPE 7 (3 RIR)
- 81%
- RPE 6.5
- 80%
- RPE 10 (0 RIR)
- 86%
- RPE 9.5
- 85%
- RPE 9 (1 RIR)
- 84%
- RPE 8.5
- 82%
- RPE 8 (2 RIR)
- 81%
- RPE 7.5
- 80%
- RPE 7 (3 RIR)
- 79%
- RPE 6.5
- 77%
- RPE 10 (0 RIR)
- 84%
- RPE 9.5
- 82%
- RPE 9 (1 RIR)
- 81%
- RPE 8.5
- 80%
- RPE 8 (2 RIR)
- 79%
- RPE 7.5
- 77%
- RPE 7 (3 RIR)
- 76%
- RPE 6.5
- 75%
- RPE 10 (0 RIR)
- 81%
- RPE 9.5
- 80%
- RPE 9 (1 RIR)
- 79%
- RPE 8.5
- 77%
- RPE 8 (2 RIR)
- 76%
- RPE 7.5
- 75%
- RPE 7 (3 RIR)
- 74%
- RPE 6.5
- 72%
- RPE 10 (0 RIR)
- 79%
- RPE 9.5
- 77%
- RPE 9 (1 RIR)
- 76%
- RPE 8.5
- 75%
- RPE 8 (2 RIR)
- 74%
- RPE 7.5
- 72%
- RPE 7 (3 RIR)
- 71%
- RPE 6.5
- 69%
- RPE 10 (0 RIR)
- 76%
- RPE 9.5
- 75%
- RPE 9 (1 RIR)
- 74%
- RPE 8.5
- 72%
- RPE 8 (2 RIR)
- 71%
- RPE 7.5
- 69%
- RPE 7 (3 RIR)
- 68%
- RPE 6.5
- 67%
- RPE 10 (0 RIR)
- 74%
- RPE 9.5
- 72%
- RPE 9 (1 RIR)
- 71%
- RPE 8.5
- 69%
- RPE 8 (2 RIR)
- 68%
- RPE 7.5
- 67%
- RPE 7 (3 RIR)
- 65%
- RPE 6.5
- 64%
These are the same numbers the RPE calculator uses, so you get the same answer whether you read the chart or type in a set. The chart is widely attributed to powerlifting coach Mike Tuchscherer and his Reactive Training Systems manual. We could not check the original manual, so treat the attribution as the common one, not as a citation. The RIR-based RPE scale underneath it was tested by Zourdos and colleagues in 2016.
How do you read an RPE 1RM chart?
The chart is built on one idea: what counts is the total number of reps you could have done at that weight. Reps done plus reps in reserve. Look at the numbers and you see it everywhere:
- 1 rep at RPE 8 and 3 reps at RPE 10 are both 92%. In both cases three reps were possible.
- 4 reps at RPE 9 and 5 reps at RPE 10 are both 86%. Five possible reps.
- 2 reps at RPE 8 and 4 reps at RPE 10 are both 89%. Four possible reps.
So moving one full RPE point to the left (harder) is worth about one extra rep at the same weight, and about 2 to 4 points of load at the same reps. Half points split the difference. That is also why RPE 9.5 exists: it means "maybe one more rep, maybe not", which is a real difference in load at heavy weights.
The chart stops at 10 reps and at RPE 6.5 on purpose. Past about 10 reps, fatigue, pacing and pain tolerance decide the set more than strength, so a % of 1RM from a set of 15 says little about a single. Below RPE 6.5 the bar moves fast and most people cannot tell 4 from 5 reps left, so the percentages lose meaning.
How do you use the RPE chart to set loads?
You need an estimate of the 1RM and a prescription in reps and RPE. Then it is one multiplication:
- 1.Find the cell. The program says 5 reps at RPE 8. The chart says 81%.
- 2.Multiply by the 1RM. With an estimated squat max of 160 kg, 160 x 0.81 = 129.6 kg.
- 3.Round to a loadable weight. Put 130 kg on the bar (or 127.5 kg on a cautious day).
- 4.Let the set correct you. If 5 reps at 130 kg felt like RPE 7, add a little for the next set. If it felt like RPE 9, take some off.
Step 4 is the point of RPE. A fixed percentage assumes the lifter is equally strong every day. RPE lets the load move with sleep, stress and fatigue while the effort stays where the program wants it. If you do not know the 1RM yet, estimate it first with the one rep max calculator or from an RPE set as shown below.
Top set and back-off sets
A pattern we use with our own lifters: work up to one heavy top set, for example 3 reps at RPE 8 (86%), then drop to back-off sets at a lower cell, for example 3 x 5 at RPE 7 (79%). The chart gives both loads from the same max, so the drop is about 7 percentage points. This is coaching practice, not a study protocol, and it fits neatly into the blocks in our periodization guide.
How do you estimate your 1RM from RPE?
Run the chart backwards. Divide the weight by the cell for that set's reps and RPE. The result is an estimated 1RM, often written e1RM.
- Chart %
- 81%
- Estimated 1RM
- 100 / 0.81 = 123.5 kg
- Chart %
- 86%
- Estimated 1RM
- 140 / 0.86 = 162.8 kg
- Chart %
- 76%
- Estimated 1RM
- 60 / 0.76 = 78.9 kg
- Chart %
- 96%
- Estimated 1RM
- 200 / 0.96 = 208.3 lb
| Set you logged | Chart % | Estimated 1RM |
|---|---|---|
| 100 kg x 5 at RPE 8 | 81% | 100 / 0.81 = 123.5 kg |
| 140 kg x 3 at RPE 8 | 86% | 140 / 0.86 = 162.8 kg |
| 60 kg x 8 at RPE 9 | 76% | 60 / 0.76 = 78.9 kg |
| 200 lb x 1 at RPE 9 | 96% | 200 / 0.96 = 208.3 lb |
Then reapply the chart for the next prescription. From the 140 kg triple above (e1RM about 163 kg), 5 reps at RPE 8 is 163 x 0.81, about 132 kg. The RPE calculator does both steps for you and rounds to plates.
Our own practice for e1RM: estimate from sets of 1 to 6 reps at RPE 7 to 10, ignore sets above 10 reps, and track the trend over weeks rather than a single number. The heavier and closer to failure the set, the less room for error, which matches the research below.
How accurate is an RPE percentage chart?
Good enough to program with, not good enough to argue over a kilo. Three findings set the limits:
- RPE and %1RM move together. In Helms and colleagues (2017), 15 powerlifters worked up to a max on squat, bench press and deadlift. RPE and %1RM were very strongly related on every lift (r = 0.88 to 0.91). The authors still recommend individual load-velocity profiles for precise prescription.
- Reps at a given % differ by exercise. A 2024 meta-regression by Nuzzo and colleagues pooled 952 reps-to-failure tests from 7,289 people. Sex, age and training status had little effect, but people did more reps on the leg press than on the bench press at the same %1RM, and the spread between individuals was wider at lighter loads.
- Lifters misjudge reps left by about one. A 2022 meta-analysis by Halperin and colleagues (262 effect sizes) found people underpredicted their reps to failure by 0.95 reps on average. Estimates were a bit better closer to failure and on lower rep sets.
Put together: an RPE 8 set is often closer to RPE 7 in reality, and a chart built mostly on barbell data fits the big lifts better than a leg press or a cable row. Treat the chart as a starting point, then adjust to the lifter in front of you.
RPE scale vs Borg scale: which one is which?
Three different scales are all called RPE, and they use different numbers. Mixing them up is the most common RPE mistake in a program.
- Range
- 6 to 20
- What the numbers mean
- 6 is no exertion at all, 13 is somewhat hard, 20 is maximal exertion. Rating x 10 roughly tracks heart rate
- Best for
- Cardio intensity, exercise testing, rehab, clients on heart rate medication
- Range
- 0 to 10
- What the numbers mean
- 0 is no exertion, 10 is maximal, and a number above 10 can mark an absolute maximum
- Best for
- Breathlessness, pain, local muscle fatigue, session RPE
- Range
- 1 to 10
- What the numbers mean
- 10 is 0 reps left, 9 is 1 rep left, 8 is 2 reps left, half points allowed
- Best for
- Strength training sets and load selection
| Scale | Range | What the numbers mean | Best for |
|---|---|---|---|
| Borg RPE scale | 6 to 20 | 6 is no exertion at all, 13 is somewhat hard, 20 is maximal exertion. Rating x 10 roughly tracks heart rate | Cardio intensity, exercise testing, rehab, clients on heart rate medication |
| Borg CR10 scale | 0 to 10 | 0 is no exertion, 10 is maximal, and a number above 10 can mark an absolute maximum | Breathlessness, pain, local muscle fatigue, session RPE |
| RIR-based RPE scale | 1 to 10 | 10 is 0 reps left, 9 is 1 rep left, 8 is 2 reps left, half points allowed | Strength training sets and load selection |
The Borg 6 to 20 scale
Swedish researcher Gunnar Borg introduced the 6 to 20 scale around 1970 and set out both scales in a 1982 paper in Medicine and Science in Sports and Exercise. The 6 to 20 scale was built so the numbers rise with physical strain during steady exercise. The CDC explains the odd range: a rating times 10 correlates with heart rate, so 12 is about 120 beats per minute. The CDC also calls that only an approximation, because heart rate varies with age and fitness, and it treats 12 to 14, "somewhat hard", as moderate intensity.
The Borg CR10 scale
In the same 1982 paper Borg presented a category scale with ratio properties, which became the CR10. It runs from 0 (no exertion) to 10 (maximal), and a rating above 10 is allowed for an absolute maximum. It suits a sensation from one place, such as burning quads, pain or breathlessness. A modified CR10 is also the scale behind session RPE.
The RIR-based lifting scale
The 1 to 10 scale on the chart above is the one strength coaches mean. It ties each number to reps in reserve, which makes it concrete for a set of squats in a way that a Borg rating is not. A Borg "13, somewhat hard" tells you nothing about how many reps were left.
When do you use the Borg scale and when the RPE chart?
- Steady cardio, intervals and conditioning
- Fitness and exercise tests
- Clients whose heart rate is changed by medication
- Whole-session effort (session RPE, CR10)
- Barbell and dumbbell working sets
- Choosing today's load from a % of 1RM
- Estimating a 1RM without testing it
- Autoregulating top sets and back-off sets
For a cardio session, Borg pairs well with heart rate. If a client's rating and their heart rate zones disagree, ask why: poor sleep, heat and medication all show up there. For the weekly overview, session RPE puts every session on one number: the CR10 rating times the minutes. A review by Haddad and colleagues gives the example of an 87 minute session at RPE 4, which is a load of 348 arbitrary units. The method was validated by Foster and colleagues in 2001, who found it tracked heart rate based load across cycling and basketball.
Our own rule: one scale per type of work, written at the top of the program. Lifting sets get the 1 to 10 RIR-based RPE. Conditioning gets Borg 6 to 20 or heart rate. Session RPE uses CR10. Then an "8" can never be misread.
How do you prescribe RPE and % of 1RM in Scraler?
In the Scraler workout builder each exercise can show an RPE column, an RIR column and a % of 1RM column, set by set. You can write the weight in kilograms or as a percentage of 1RM, so a set can read "5 reps, 81%, RPE 8": the chart load and the effort that corrects it. When you build for a specific client, each exercise has a 1RM history button.
During a live session the log shows the target for each set, so the client sees the RPE they are aiming for while they enter weight and reps, and RPE is one of the columns you can choose to log. For cardio, write the Borg target in the exercise notes and review how the week felt in a check-up.
Add RPE, RIR and % of 1RM targets to any set in the workout builder, and see each client's 1RM history while you program.
See workout planningTo collect weekly effort and session ratings without chasing clients, see client check-ups.
Frequently asked questions
- What is an RPE chart?
- An RPE chart is a table that gives the load as a percentage of your one rep max for each combination of reps and RPE. For example, 5 reps at RPE 8 is about 81% of 1RM and 3 reps at RPE 9 is about 89%. Coaches use it to turn an RPE prescription into a weight and to estimate a max from a normal set.
- What percentage of 1RM is RPE 8?
- It depends on the reps. On the chart, RPE 8 is about 92% for a single, 86% for 3 reps, 81% for 5 reps, 74% for 8 reps and 68% for 10 reps. RPE 8 means two reps were left in reserve.
- How do I calculate my 1RM from RPE?
- Divide the weight lifted by the chart percentage for that set's reps and RPE. 100 kg for 5 reps at RPE 8 is 100 divided by 0.81, an estimated 1RM of about 123.5 kg. Sets of 1 to 6 reps near failure give the most reliable estimates.
- Is the RPE chart accurate?
- It is an approximation. RPE and %1RM are strongly related in powerlifters, but reps at a given % differ between exercises, and lifters underestimate their reps left by about one rep on average. Use the chart for a starting load and let the felt RPE of the set adjust it.
- What is the difference between the RPE scale and the Borg scale?
- The lifting RPE scale runs from 1 to 10 and each number means reps in reserve, so RPE 8 is two reps left. The Borg RPE scale runs from 6 to 20 and rates overall exertion during cardio or testing, where a rating times 10 roughly tracks heart rate. They are not interchangeable.
- What is the Borg CR10 scale used for?
- The CR10 is Borg's 0 to 10 category ratio scale, with 0 for no exertion and 10 for maximal, and a number above 10 allowed for an absolute maximum. It is used for breathlessness, pain and local muscle fatigue, and a modified CR10 is the basis of session RPE.
- Who made the RPE percentage chart?
- The chart is widely attributed to powerlifting coach Mike Tuchscherer of Reactive Training Systems. The RIR-based RPE scale it relies on was tested in a 2016 study by Zourdos and colleagues in the Journal of Strength and Conditioning Research.
- Can I use the RPE chart for high rep sets?
- Not well. The chart stops at 10 reps because past that point fatigue and pacing decide the set more than strength, and a 2024 meta-regression found the spread between individuals grows at lighter loads. Use low rep sets to estimate a max.